Native Swift · Built for agentic developmentNative Swift · Built for agentic development · Nothing leaves your Mac
Observability that never leaves your Mac.
Loggerhead is a Mac app that watches the software you run on your machine. It collects the logs, numbers, and request traces your app produces and shows them in one clear window. Your AI coding tool can read the same data. Nothing leaves your Mac.
- macOS 15 or later
- Apple silicon and Intel
- Notarised, free to start
- Native Swift, no runtime to install
- 14:02:1114:02:11.204ERRORcheckoutpayment provider timeout after 3000ms (trace 7f3a…c1)
- 14:02:1114:02:11.198WARNpaymentsretrying charge: attempt 2/3 for order #48213
- 14:02:1014:02:10.977INFOgatewayPOST /api/checkout 200 in 412ms
- 14:02:1014:02:10.931INFOinventoryreserved 2 units of SKU-9931 for cart c_18f2
- 14:02:1014:02:10.880DEBUGcheckoutloaded cart c_18f2 with 3 items
- 14:02:1014:02:10.412INFOauthsession refreshed for user u_2291
- 14:02:0914:02:09.760WARNinventorystock for SKU-1102 below threshold (4 left)
- 14:02:0914:02:09.301INFOgatewayGET /api/cart/c_18f2 200 in 38ms
- 14:02:0814:02:08.115FATALpaymentsconnection pool exhausted, restarting worker
- 14:02:0714:02:07.902INFOgatewayPOST /api/login 200 in 91ms
- 14:02:0714:02:07.455DEBUGauthtoken verified (kid=2024-09)
Three signals, one window
Logs, metrics, and traces that already know each other.
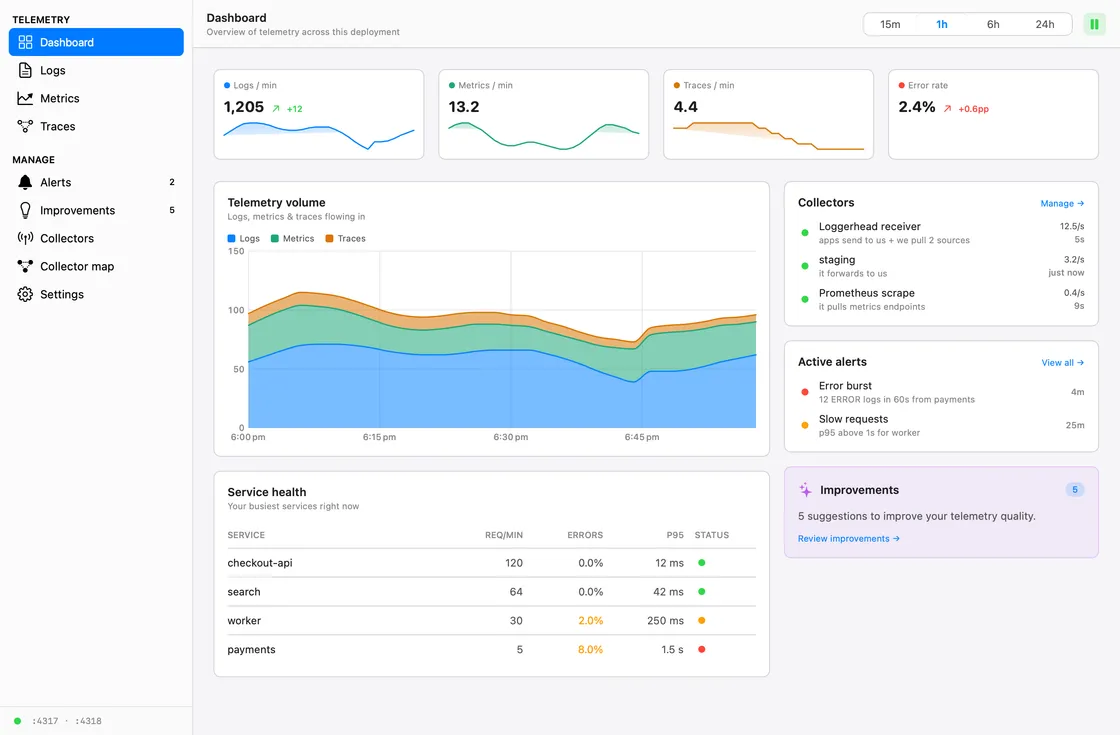
Click a log line and jump to its trace. Click a span and see the logs it emitted. One local store keeps every signal in the same time base, so you stop stitching tabs together.
Logs that stream, not scroll
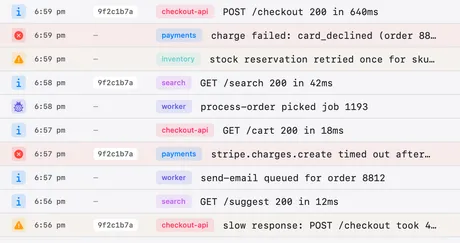
Severity tints, service colours, and filters for level and service. Search the message text, pause the stream, and open one line to read its fields.
Metrics with a memory
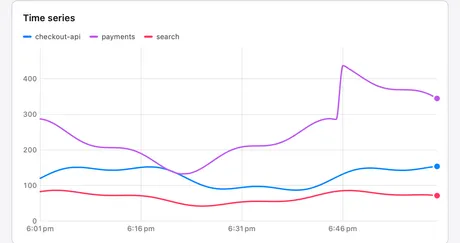
Counters, gauges, and histograms land in DuckDB. Pick any window, group the series by label key, and compare services without an exporter in the middle.
Traces you can actually read
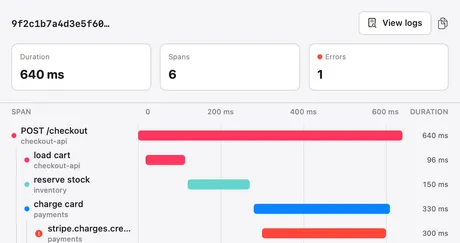
A waterfall per request, spans grouped by service, and the slow one highlighted. Jump from a span to the logs it produced in one click.
Built for agentic development
Give your coding agent eyes on the running app.
AI coding tools guess when they cannot see. Loggerhead gives them a window into your running app through MCP, an open standard those tools already speak. The tool reads what your app actually did, then fixes the real problem.
- Search logs and traces by service, severity, attribute, or trace ID
- Aggregate metrics over any window without a query language
- Local only. The app hosts the MCP endpoint on 127.0.0.1
- One click to connect Claude Code, Cursor, Codex, or Windsurf
WORKS WITH
- Claude Code
- Cursor
- Codex
- Windsurf
- Any MCP client
>checkout is returning 500s locally. why?
loggerhead.query_logs { query: "checkout", severity: "ERROR", limit: 20 }
3 results · trace 7f3a…c1 in 2 of 3
loggerhead.get_trace { trace_id: "7f3a…c1" }
9 spans · payments → provider.charge 3,004 ms (timeout)
The 500 comes from payments. The call to provider.charge waits 3,004 ms and hits the 3 s client timeout in payments/client.go:41. The retry then double-charges. I will raise the timeout to 8 s and make the retry idempotent.
payments/client.go
- Timeout: 3 * time.Second,
+ Timeout: 8 * time.Second,
>█
WORKS WITH
- Claude Code
- Cursor
- Codex
- Windsurf
- Any MCP client
One root, many branches
Push telemetry in, or let Loggerhead pull it.
The app runs the receiver on localhost. Docker, Kubernetes, another Mac, or your app's SDK pushes into it as a branch. Loggerhead can also scrape a URL on a schedule, so tools that only expose metrics still show up. Every source gets an ID, so you always know where a record came from.
- Docker hostotel/opentelemetry-collector-contribOTLP
- Kubernetesk8s receivers on a branchOTLP
- Another Macotel-cli or a branch collectorOTLP
- Your app's SDKOTLP exporter, straight to the rootOTLP
- Scrape a URLPrometheus /metrics, polled every 15 sPULL
 Loggerhead receiverruns inside the app · pushes in, pulls out
- gRPC
- 127.0.0.1:4317
- HTTP
- 127.0.0.1:4318
- Auth
- none needed, loopback bind
Listens on127.0.0.1 · port picked for you
collector.id = docker-mac
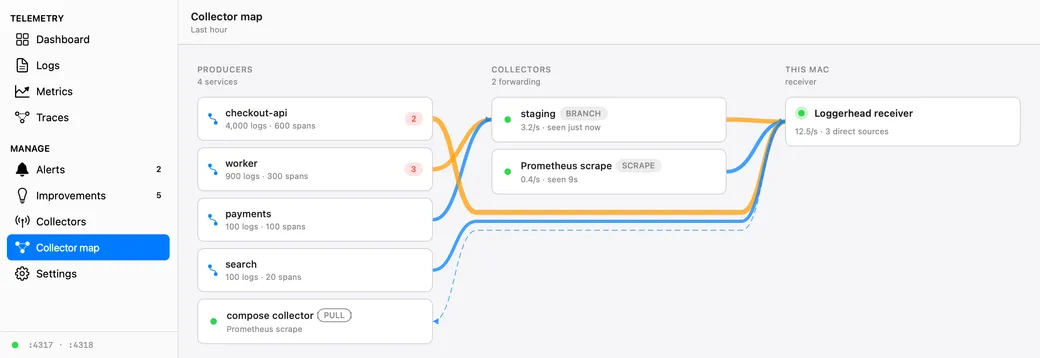
The app draws the same picture from live traffic. Every collector shows the services it carries, its record rate, and the moment it last spoke.
Telemetry linting
Lint your telemetry before production sends you the bill.
Most apps log too much and measure the wrong things. Loggerhead reads what your app emits and points at the junk: noisy debug lines, labels with thousands of values, secrets in plain text, and errors that lost their trace. Every finding comes with the fix already written. Copy it into the AI tool in your project, and the agent changes the code.
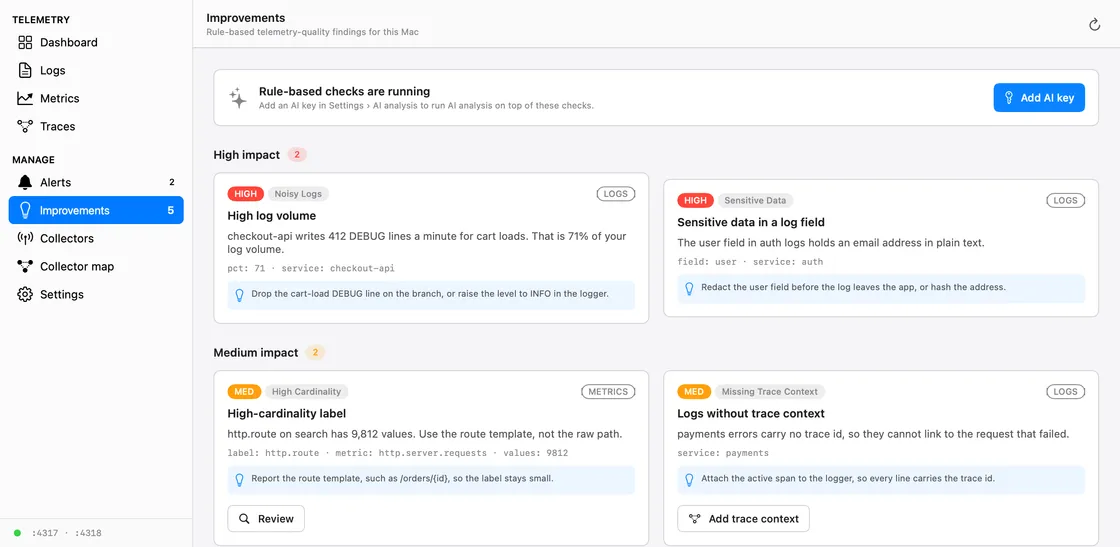
- 1.Loggerhead finds itRules read the last window of real telemetry and name the problem, the service, and the field.
- 2.You copy the fixEvery finding carries the fix in plain words. One copy, and no query language to learn.
- 3.Your agent applies itPaste it into Claude Code, Cursor, Codex, or Windsurf. The agent edits the logger or the collector config in your project.
- Cut the noiseDrop and sample the lines nobody reads. Keep the ones that explain a failure.
- Catch secrets earlyEmails, tokens, and card numbers get flagged before they reach anyone's logs.
- Keep traces wholeEvery error links to the request that caused it. No more orphan logs.
- Fix it where the code isThe fix goes to the tool that already has your project open, so the change lands in your repository.
Made for the person who runs the app
A development environment for how your code behaves.
Loggerhead is not a production observability platform, and does not want to be. It is the window you keep open next to your editor while you build, test, and stage.
Solo developers
One native app, one window, zero infra. See what your side project actually does before you ship it.
- Runs with your app, not next to a cluster
- Nothing to host, nothing to pay per GB
- Query a week of local traffic in milliseconds
Staging and preview
Point a staging cluster at your Mac over a tunnel and get a full picture of a release before it goes live.
- Branch collectors for Docker and Kubernetes
- Per-collector attribution on every record
- Alerts and improvement hints on real traffic
Agent-first workflows
Give Claude Code or Cursor the same view you have. The agent reads logs and traces over MCP, then acts on facts.
- MCP server included, one click to add
- Search, aggregate, and trace lookups as tools
- Local only, so the agent never sees prod
Honest scope: DuckDB on one Mac. Great for local and staging traffic. Keep your production platform for production.
Up in three steps
From download to your first insight in under two minutes.
Install the app
Download, open, and drag Loggerhead to Applications. The receiver, the store, and the MCP server all run inside the app. There is nothing else to install.
Choose what to watch
Inside Loggerhead, pick a source: an app on this Mac, Docker, Kubernetes, or a URL to scrape. Loggerhead picks a free port for you.
Connect your AI coding tool
Pick the tool you use and click once. It can then read what your app did and fix real problems.
Add Loggerhead to Claude CodeWorks with any tool that supports MCP.
Buy once, keep it
One licence. No seats, no ingest bill, no renewal.
Free
$0forever
Everything a solo developer needs to see one app on one Mac.
- Logs, metrics, and traces
- The Loggerhead receiver and one branch collector
- One pull source and one scrape endpoint
- MCP server for your coding agent
- Support by email
Pro
$79one-time · up to 3 Macs
For staging traffic, many collectors, and the alerting that catches a bad release.
- Everything in Free
- Unlimited branch collectors
- Unlimited pull sources
- Standalone receivers and unlimited scrape endpoints
- Keep data as long as you like
- Telemetry linting, with the fix written for your AI tool
- Alerts, native notifications, and menu bar status
- A year of updates, then keep the version you have